by Martin Heng
Technological advances have led to enormous benefits for the disability community. They have increased the independence of people living with spinal cord injury, particularly high-level quadriplegics, to an extent few would have imagined 20 years ago. Technology has changed our lives, from smartphones and tablets to voice-activated control of lights, doors, and heating – not to mention the software I’m using to write this article!
I first met Natalie Verdon, cofounder of Briometrix, several years ago. I was immediately struck by the enormous potential of the company’s innovative and highly technical approach to mapping the accessibility of environments – not just towns and cities but also parks and trails.
Some progressive councils around the country have produced “mobility maps” that show accessible routes, accessible toilets and a few other accessible features, such as disabled parking spaces. But they are limited in scope and quickly go out of date, particularly with the amount of construction underway seemingly everywhere. Briometrix colour-coded mobility maps show accessible footpaths and how they connect places of interest, facilities, accessible parking, taxi ranks and mass transit networks – even tracking through railway stations right to your departure platform. Colours show the level of effort for wheelchair users, which is why the maps they generate are called effort-based mobility maps.
In fact, the founders – Natalie and Eckhard Kemmerer, with whom I shared a stage at the 2018 Vivid Festival to discuss how accessibility makes for a more inclusive, liveable city – were designing a new wheelchair when they realised that the navigation and fitness app boom had ignored the wheelchair community. These applications are all the rage, empowering people to track their activity as part of their everyday fitness regime via their Apple Watch, Fitbit or Garmin. Natalie and Eckhard asked themselves why the wheelchair-using population should miss out on the health benefits everyone else enjoys from technological developments. At the same time, they wondered why governments would not support an initiative to improve the activity levels and health outcomes for an at-risk sedentary population: a healthier, more active population, including wheelchair users, saves billions of dollars in healthcare costs.
Mobility maps that accurately capture gradient, pavement surface, kerb cuts, obstacles and obstructions, and accessible public transport stops will benefit not only wheelchair users but anyone using wheels: parents with strollers, seniors with walkers and mobility scooter users, but also skateboarders, rollerbladers and scooter users, not to mention people with suitcases or goods trolleys. What’s more, the incredibly detailed data Briometrix collects can drive infrastructural change as councils gain a deeper understanding of what improvements are needed to make their neighbourhoods more inclusive.
Briometrix has worked closely with therapists, city and transport managers, sports physiologists and access consultants. But most importantly, they employ wheelchair users to go out on the ground using their eyes, experience and judgement – as well as the technology provided to them – to map designated areas. As Kemmerer puts it: “People in wheelchairs measuring footpaths makes profound sense the moment you see it.”
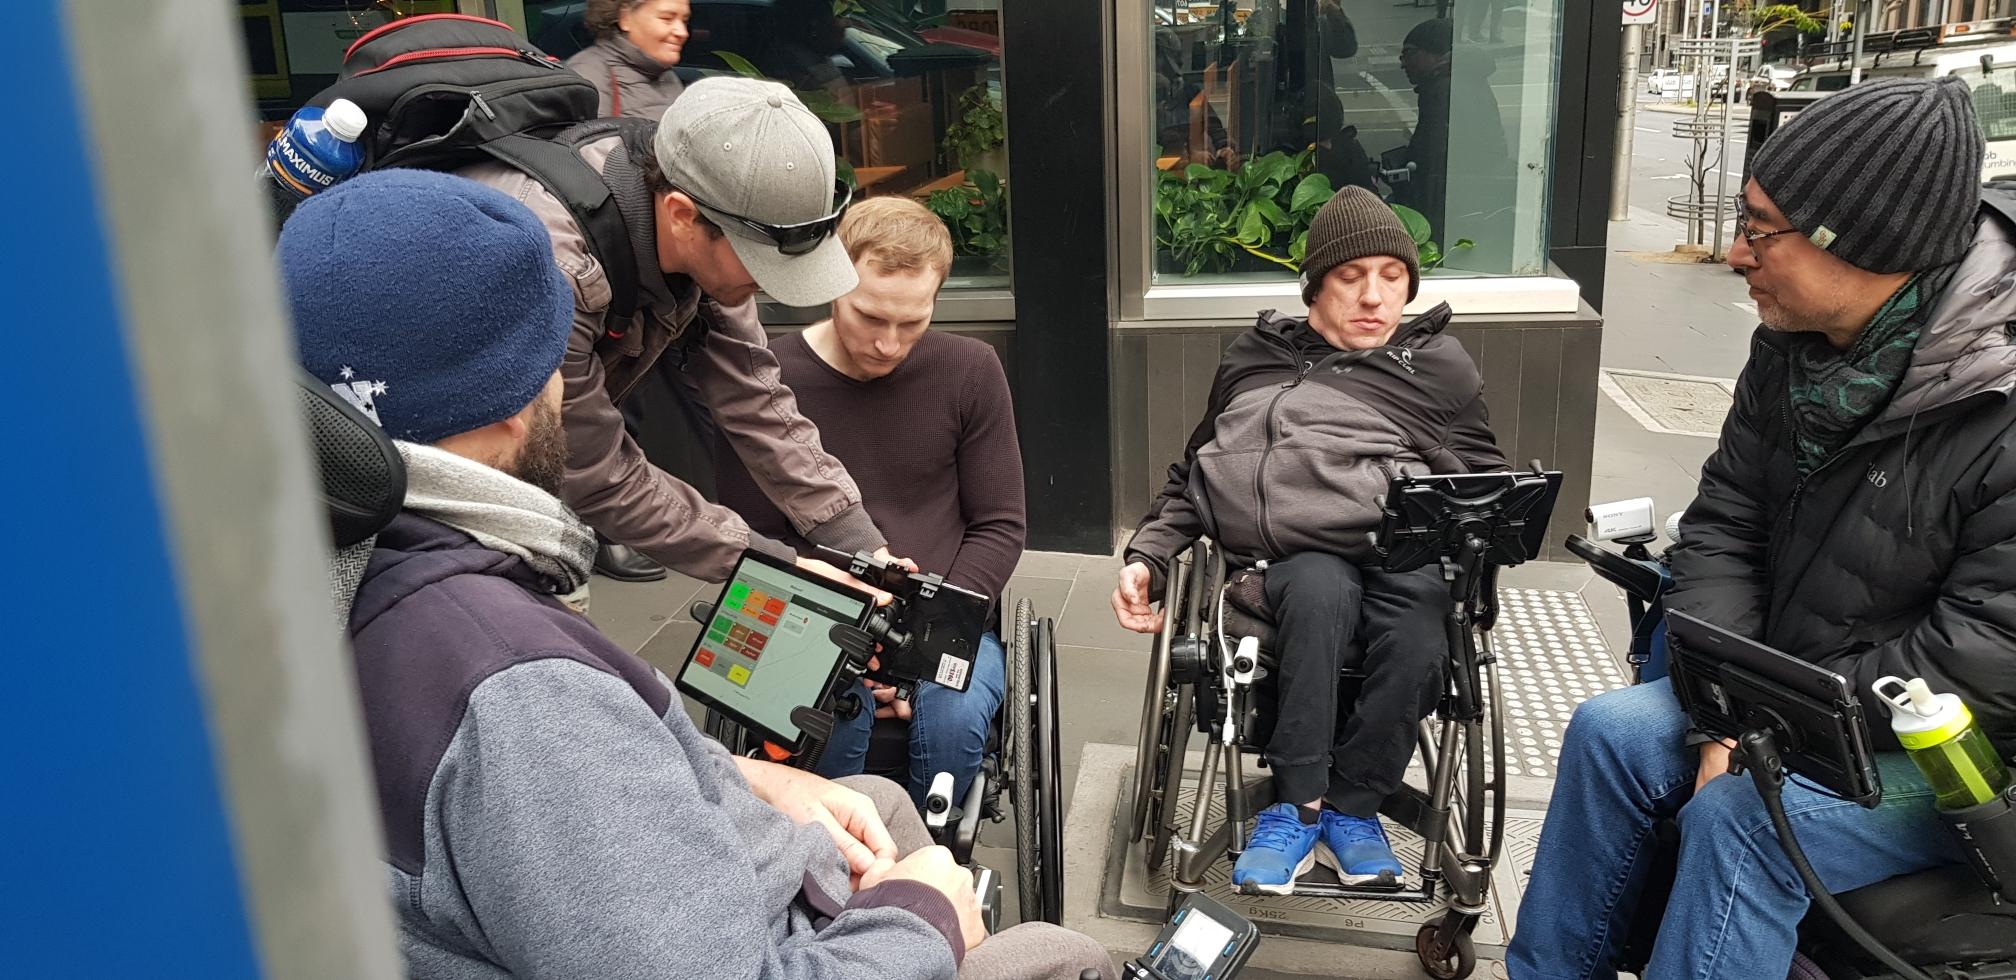
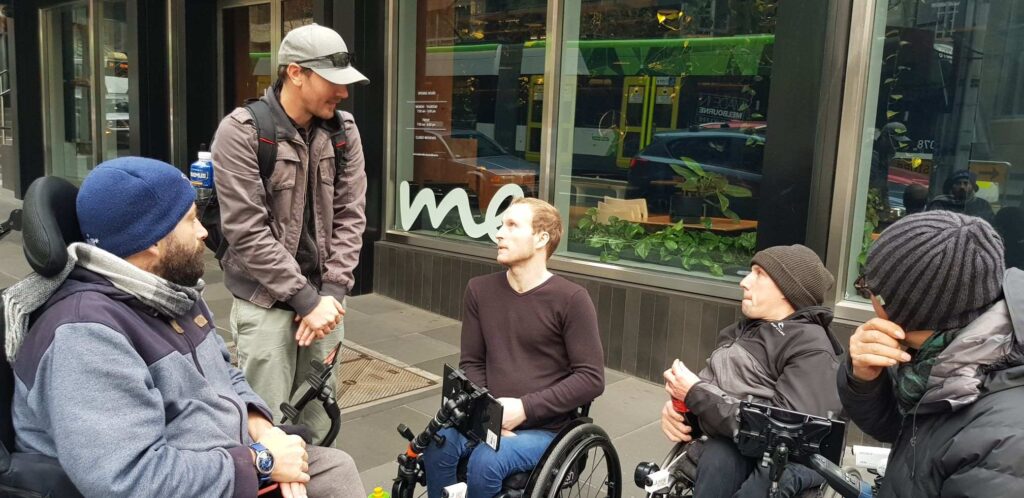
Having been a supporter of the project for so long, I was keen to be part of Briometrix’s latest and most ambitious project: to map Melbourne’s southern CBD, including its arts, entertainment and sporting complexes for Victoria’s Department of Transport. The mappers were a mixture of power wheelchair users and manual wheelchair users, and we met in Eckhard’s hotel room to be fitted with a video camera and GPS locator. We were also given an iPad to record data to an incredible level of detail – for example, there were six different types of surfaces to choose from – including taking photos of obstructions and hazards such as potholes or tree roots. Initially, at least, the complexity and the amount of data we were collecting was a bit overwhelming, and I pitied my manual wheelchair–using colleagues who also had the physical effort of pushing! But at the end of each day, when I came to have my equipment demounted, it was so rewarding to see how much data had been synced and the map gradually taking shape. You can watch me and fellow wheelchair pilot, Joel de Munk, discuss our experience with the mapping project in this video.
You can read about the Briometrix pilot project with the Queensland government here: interactive maps were created for Brisbane, Townsville and Rockhampton. Its project with Shepperton was designed partly to cater to the accessible tourism market, and could be replicated in other tourist destinations – which was undoubtedly behind the decision to map Melbourne’s arts and sporting precincts. Its project with Townsville shows how the dataset can be used to drive infrastructural improvements, which was part of the council’s brief to Briometrix. The company is keen to access further funding to allow them to scale its operations up. Its Melbourne project is awaiting final signoff by the Department of Transport, and I can’t wait to see the results!